Blog
Oracle Analytics Cloud 'Explain' Feature Hints at the Power of Machine Learning
After working for well over a decade in Business Intelligence primarily focusing on Oracle Business Intelligence (OBIEE) , Oracle Analytics Cloud (OAC) offers many new ways to interact and learn from an organization's data. Data Visualization is an application that provides a new level of interactivity and simplicity to building ad hoc reports that are easy to understand and navigate, but that at least is a natural evolution of the concepts I had been honing for years and years. There are other features within OAC that feel like completely uncharted territory for me, even after all those years. Specifically, DV contains a Machine Learning module that blows the doors off of what's possible with the BI suite of tools.
What is Machine Learning?
To over simplify, Machine Learning is the process of using Artificial Intelligence to interpret sets of data with minimal human interaction. Even the best, most coherent dashboards and reports still require at least one person to be familiar with the data, what it represents, and the questions and answers it serves. Machine Learning looks to automate pieces of that process to provide insights and answers from your data, both to your questions and to questions you may not have even considered.
Oracle Analytics Cloud includes a Machine Learning module within Data Visualization and this post will be the first in a series exploring the concepts and applications of Machine Learning within OAC.
For now, let's look at one of the ways Machine Learning is already integrating with normal functionality of OAC.
Explaining Data
When I first heard OAC had an "explain" function built in, my first instinct was to think of the command to display a SQL database's execution plan, but OAC has a built in feature that actually leverages some ML scripts to profile selected data elements to illustrate insights about them.
Within DV, you can right click on a data element and select "Explain [Field Name]" to utilize these built in scripts that require no configuration on your end.
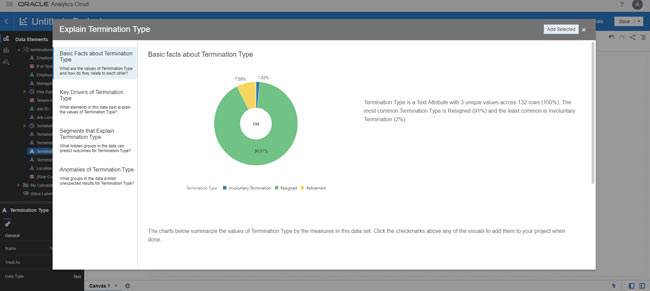
The result is a profile of the data element you've selected with both visualizations and narrative text to explain the insights for the element that is being analyzed. Note in the screenshot above, you get both the donut chart showing the distribution of the data element within the data set as well as a short text description.
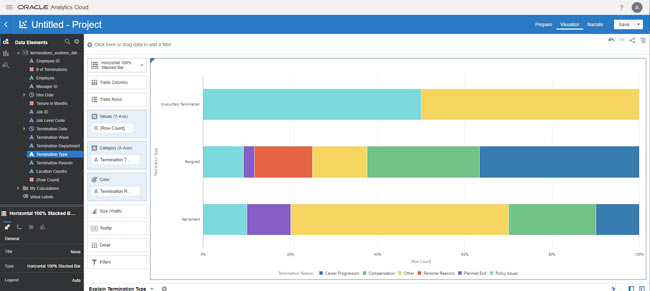
You can even select the visualization, then click "add selected" and immediately begin to use Data Visualizations project editor to customize to drill further. For example, I took the donut chart shown above and added Termination Reason to analyze the various Termination Types further.
The Explain feature is maybe the best way to demonstrate the possibilities of Machine Learning at a very basic level. By creating these insights from just looking at the content of your data, you're starting to get answers to question you haven't really asked yet. In addition, you're also starting to see how the AI can begin to pull the data apart and provide narrative context for the information, which traditionally has always leaned heavily on human interaction to achieve.
Over the next few blog posts on Machine Learning, we will start to look at utilizing scripts for ML and how flexible OAC truly is in depth statistical analysis and creating more complex actionable insights for a specific purpose.
Contact MindStream Analytics
Want to know more about Oracle Analytics Cloud? Please complete the form below and we'll get back to you shortly.


Partner SpotLight

Oracle
Oracle has the most comprehensive suite of integrated, global business applications that enable organizations to make better decisions, reduce cost..