What is Predictive Analytics?
Introduction
A dashboard or a report can give you key facts about performance metrics for your company. You are surprised with the results. To find out what caused this abnormality, you try to put the results under the microscope. The analysis that you conduct brings up the relationships that you did not know existed. You find out that certain customers tend to buy more products than they have in the past. Has something changed? What happened to the pattern that you relied on?
You cannot get this finding out of your head and you decide to mine the data to see if you can find any factors that caused this change and whether they are significant. What you get as a result is five customer categories instead of two. You evaluate these new customer segments and build a new model to create opportunities in these new segments. The new model helps in your every-day decision making processes.
What is Predictive Analytics?
Empirically-derived models used for predicting future outcomes. It helps firms better understand and predict customer behavior. It brings key business insights into our decision-making processes and creates positive return on investment.
Goals of Predictive Analytics
There are 4 areas that the companies should focus on leveraging predictive analytics:
The very first area is customer analytics. In the current environment, every firm is competing to acquire new customers, retain existing customers. Customer analytics takes care of client segmentation so the company can approach and market to customers as individuals. This approach can include analyzing social media and other unstructured data to better understand the customer behavior in order to take actions that would decrease customer churn and increase the level of customer loyalty.
The second area the companies should focus on is to use analytics to build and transform their financial processes. Organizations' priorities have always been to improve the planning and forecasting processes, to be competitive in the very dynamic market environment. They would like to be able to automate financial consolidation process and review their activities in the real time.
Another area is using analytics to manage risk and make the right decisions and the right time. After 2008 financial crisis each of us needs a method to oversee the unprecedented events. Predictive analytics can help manage both financial and operational risk, and significantly reduce the cost of compliance.
Finally the last area is the area of efficiency in the operations. Firms use analytics to avoid threats, fraud, as well as unnecessary high cost for maintenance. Predictive analytics can help predict when maintenance is needed before failure. Banks can predict the fraud before it even happens.
How to build Predictive Analytics Model
|
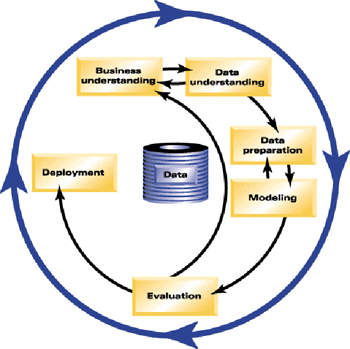
CRISP-DM is a Cross-Industry Standard Process for Data Mining. CRISP is comprehensive data mining methodology. The model offers a step-by-step tasks and targets for each part of the process. CRISP-DM allows for extensive data mining projects faster, more efficiently and less expensively through the best practices. The model helps to avoid common mistakes. The development of methodology CRISP-DM was launched as a project of the European Commission defined as the standard model procedure for creating data-mining projects. The life cycle of the mining project using CRISP-DM methodology consists of six phases. The order of the phases is not hard coded. The result achieved in one phase influences the choice of the following steps, it is often necessary to tape and return stages. |
Business understanding is the initial phase focused on understanding the project objectives and requirements for the solution formulated from a managerial point of view. The formulation of management must be transferred to the design task.
Data understanding phase includes the understanding of the data from the initial data collection. The following are the activities in order to get a basic idea about the data that are available (assessment of data quality first "insight" into the data, finding interesting subsets of records in the database...). Usually detect various characteristics of descriptive statistics (frequency values of various attributes, the average value, minimum, maximum, etc.). Preferably, we can employ various visualization techniques.
Data preparation involves activities that lead to the creation of a data file that will be processed by different analytical methods. This data should therefore contain information relevant to a given task, and take the form, which is required to own analysis algorithms.
Analytical methods used in the phase of modeling include algorithms for data mining. Usually there are a number of different methods for solving a given task, it is necessary to choose the best (recommended to use multiple methods and combine their results) and appropriately adjust their parameters. It is again an iterative operation (reapplication algorithms with different parameters), moreover, the use of analytical algorithms may lead to the need to modify the data and thus to return to the data transformations from the previous phase.
Evaluation. In this stage interpretation of the achievements are evaluated from the perspective of users, from the viewpoint of whether their goals were met as defined at the beginning of the project.
By deploying an appropriate model, the entire project generally does not end. Even if the solution of the task was only a description of the data, the knowledge gained should be adjusted to form usable for decision support. According to the type of role the deployment phase on the one hand can mean simply writing the final report, on the other the implementation of hardware, software, organizational system for automatic classification of new cases.
Gartner Magic Quadrant
|
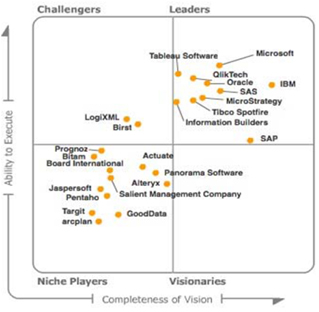
Year over year, Gartner evaluates the market for business intelligence platforms. Predictive analytics have been added to their evaluation criteria and it is becoming more and more important among the industry analyst firms to introduce it in the market. In the chart we can see big players but also new growing software companies that have turned to big data and predictive analytics right from the beginning of their existence. |
Conclusion
The business analytics world now is changing in real time. We are facing challenges that have outgrown our three dimensional space. Time is our biggest enemy and to be able to predict, prevent, and adjust for potential risk grew in importance more than ever. The moment of streaming analytics, and dynamic predictive modeling is here and we all need to get ready. No matter where we start or what we need to do, today's business environment is very competitive and demanding. By the end of the day, you should be prepared to answer the questions that will guide us through the building foundations leading to mastering the predictive analytics. Have you planned your analytics journey? Is your current approach sustainable and cost effective? Will you be ready to support your business teams' demands? Whether you are IT or business or have a foot in both camps, you are judged by how well you enable your constituents. Jump in and make this happen.
Contact MindStream Analytics
Want to know more about Predictive Analytics? Fill out the form below and a MindStream Consultant will contact you.
Partner SpotLight

Board
BOARD provides a seamless software solution for the support, control and management of core processes such as Reporting and Analyses; Budgeting, Planning, Forecasting; Profitability Modeling and Optimization; Simulation and What-if Analysis; Scorecarding; Financial Consolidation; Statutory and Financial Reporting; Monitoring and Auditing.