How OneStream Dashboards Streamline Data and Workflows
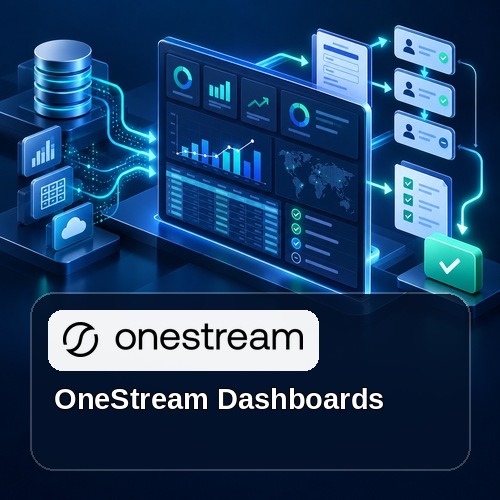
OneStream dashboards combine governed financial data, process status, forms, charts, grids, parameters, and actions in a role-based experience. A thoughtful dashboard helps users understand performance, complete workflow tasks, investigate exceptions, and move from insight to action without switching among disconnected tools.
OneStream XF has exploded in popularity over the last few years as a versatile unified platform to manage a wide variety of your business needs. One area that has become robust is the dashboarding functionality of the application, which provides a canvas to present to end users of any organizational level that may include a mixture of charts and graphs, narrative text, or even portions of your processes.
Today’s market contains a hefty variety of options for visualization. I’ve worked with many as a Business Intelligence consultant to display data in a variety of formats to paint the story of an organization’s data in a way that is intuitive and insightful. OneStream’s dashboarding functionality provides that same capability with the system’s financial data.
As a lifelong BI developer and administrator, I love the idea of having this type of functionality built directly into the transactional system and not relying on ETL processes to pull the data out into another system to be analyzed. Of course, there are plenty of benefits to building data marts and warehouses, but OneStream’s built-in tools allow an implementation to contain so much of that functionality directly within the solution, which aligns perfectly with the overall product strategy to have OneStream be the single point of interaction and not having multiple systems to maintain and use to perform and maintain regular business processes.
With OneStream, you can achieve so much of this right within the app. The dashboards within OneStream serve a variety of purposes and are more than simply a way to display some charts of your data, although it does that, too.
Here are just a few of the common applications of dashboards in a OneStream implementation:
Visualizing Data
The first and most obvious function of OneStream’s dashboards is to display visualizations based on your data. This means producing reusable, well-defined metrics to illustrate the performance or progress of different areas of your business. This features the usual suspects of charts and graphs, all built based on cube views of your data that you also define. Here’s an example of a rich dashboard with visualizations:

Financial Reports
Dashboards can also serve as a quick, easy to navigate location for financial reports. Think of having your Income Statement and Balance Sheet defined and developed and able to be refreshed from month to month. Those can be accessible via a dashboard to have them easily accessed when needed.
Landing Pages for Process Management and Administrative Tasks
You can also leverage dashboards to develop interfaces for receiving input from correctly provisioned users or to view, manage, and execute tasks assigned to your position. This means a forecast manager can view a dashboard tailored to their job function to review and execute tasks within the forecasting process, all from within the same sets of interfaces every other OneStream activity is performed in.
Further, you can run reports within your dashboard to audit your progress and your teams at any given point in the cycle, making your dashboards a sort of command center for the financial processes that occur each period.

OneStream’s Dashboards are robust and flexible. They allow you to view data in ways that both inform the executive level while enabling the analysts to perform their regular processes. In upcoming blog posts, I will walk through the individual components of dashboards to show just how flexible and easy to maintain they are, as well as provide additional examples of how they can be leveraged to get even more value from your OneStream implementation.
OneStream Dashboards Design and Governance Workflow
Effective OneStream dashboards begin with a defined audience and decision. Choose only the measures, filters, and actions that support that purpose. Use consistent labels, colors, and time periods so users can interpret results quickly and avoid competing versions of the same metric.
Separate summary information from diagnostic detail. Executive users may need trends and exceptions, while analysts need drill-down, Cube Views, supporting transactions, and controlled input. Parameters can preserve one design while adapting content to a user, workflow, entity, scenario, or period.
Performance should be tested with realistic data volumes and security profiles. Limit unnecessary components, optimize data adapters and member filters, and avoid refreshing information that does not change. Confirm browser, tablet, and phone behavior when those clients are in scope.
Govern OneStream dashboards like other production assets. Document ownership, data sources, business rules, parameters, navigation, and release testing. Review adoption and response times after launch, then simplify components that do not help users complete a decision or process.
OneStream Dashboards and Reporting Resources
For more guidance on OneStream dashboards, explore OneStream dashboard services, linking Cube Views to dashboards, displaying XF tables in dashboards, creating dashboard pop-up dialogs, primary dashboards in OneStream. Also review the official OneStream dashboard components documentation.