How Oracle R Enterprise Identifies At-Risk Students

Oracle R Enterprise helps universities analyze student data at scale, identify factors associated with graduation outcomes, and focus intervention resources where they can have the greatest impact. This example follows a CRISP-DM workflow, combines multivariable regression with database-resident data, and presents the results through Oracle Business Intelligence Enterprise Edition (OBIEE).
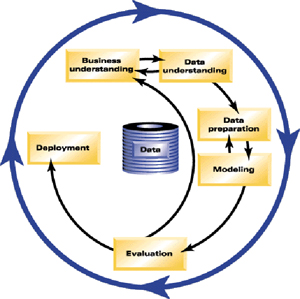
We followed CRISP-DM or Cross-Industry Standard Process for Data Mining. The general CRISP-DM process model includes six phases that address the main issues in data mining. The six phases fit together in a cyclical process designed to incorporate data mining into your larger business practices.
|
To mine, model, and predict we used Oracle R Enterprise. For visualization of the results we used OBIEE. R is an open-source language and environment that supports:
As mentioned previously, R is a statistics language that is similar to SAS or SPSS.
|  |
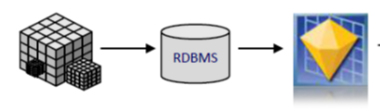
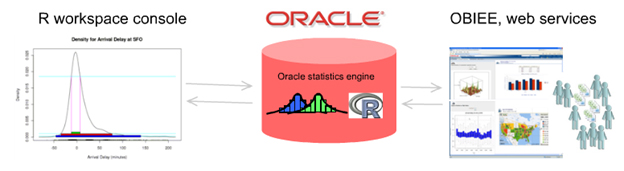
Oracle R Enterprise (ORE) contains a statistics engine, and provides transparent access to database-resident data from R
We gathered data from different sources into R, joined them into a table and ran several multivariable regressions.

After running several iterations and omitting insignificant variables we got to the final model:

|
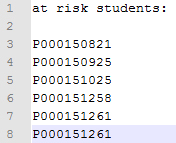
Factors such as high school GPA, student’s ethnicity, or the amount of financial aid needed had the most significant coefficients. Our level of significance was 0.05. Our final model then consists of parameter filler where by loading new student data we can identify at risk students. |
|
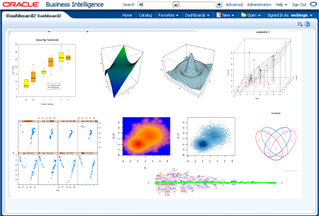
The results and graphical analysis can then be projected into Oracle Business Intelligence Enterprise Edition (OBIEE). The reports and functions are dynamically generated through execution of the SQL query that invokes the R function stored in the database R script repository. Oracle R Enterprise enables graphical, analytical, and statistical insights to be deployed throughout the enterprise using OBIEE.
Results
Teachers and administrators can now identify at-risk students and constructively intervene with personalized assistance. Predict which intervention activities will have the optimal impact on students. At least 25 hours cut off the workload.
Modeling and Validation Workflow
The project began with a clear business objective: identify students who may need support early enough for educators to act. Data from multiple sources was assembled, reviewed, transformed, and joined before modeling. This preparation matters because inconsistent definitions, missing values, and duplicate records can distort coefficients and lead to unreliable predictions.
With the platform, analysts can work with database-resident data from the familiar R environment. The approach keeps large datasets close to the database, supports repeatable transformations, and makes it practical to test several multivariable regression models. Variables that did not contribute meaningful explanatory value were removed through successive iterations while the team retained factors that met the selected significance threshold.
Model output should be interpreted with academic and operational context. A strong coefficient can indicate an association, but it does not automatically prove causation. Teams should review data lineage, test assumptions, compare results across student groups, and monitor whether predictions remain reliable over time. These checks help universities use analytics responsibly while reducing the risk of overgeneralizing from historical patterns.
Once validated, the final model can accept new student records and produce indicators that help prioritize outreach. OBIEE can then expose the analytical output through governed reports and visualizations. This combination allows administrators to move from isolated analysis to a repeatable decision-support process without losing the supporting statistical detail.
The strongest outcome is not the score itself but the action it enables. Advisors can combine model signals with direct knowledge of a student, select an appropriate intervention, and track whether the response improves engagement or persistence. In this way, Oracle R Enterprise supports a measurable feedback loop between analytics, personalized assistance, and graduation strategy.
Related Analytics Resources
To expand your understanding, explore Oracle Analytics services, Oracle OBIEE consulting, what OBIEE is, business intelligence solutions, Oracle Analytics Cloud services. Also review the official Oracle documentation for Oracle R Enterprise architecture and analytical capabilities.